
Per la versione italiana clicca qui

CoRoT satellite launch.
CoRoT (COnvection, ROtation and planetary
Transits) celebrates its 300 days in orbit, since its launch on december 27th from Baïkonour.
It started to collect scientific data on the February 2nd, and it works in normal scientific operations since 2 April 2007.
It just finished its first very long sequence of observation (150 days) towards the region of the galactic centre and has turned towards the anticentre direction in order to keep the Sun in its back on the 15th of October. Operations have been conducted from the centre de Mission in CNES Toulouse. It has then started its new long observation on October 23rd, which will last till next March.
CoRoT has observed 3 carefully selected regions of the sky: an area in the direction of the constellation of the Unicorn (Monoceros) during 60 days followed by a short (26days) and a very long (150days) pointing in the opposite direction, in the constellation of the Snakes tail (Serpens Cauda).
Light curves
CoRoT obtains "light curves", i.e. it measures the light coming from a very large number of stars with unprecedented precision for a hitherto unheard length of time. During each set of observations more than 12000 light curves have been obtained, with almost uninterrupted data.
It is now clear that CoRoT will instigate a breakthrough in both of the fields of science that it applies to.
The scientific impact of CoRoT relies on its three major characteristics never reached before for which the satellite fulfils and surpass its originals specifications:
- the precision with which the satellite is working, which is set by physical laws - not by the working of the instrument (the data are thus photon noise limited essentially over all magnitude ranges);
- the duration of the observations on the same star;
- the continuity of these observations, which have almost no interruption over these very long periods.
New discoveries
And CoRoT finds that essentially every star it observes varies.
Or better:
- CoRoT is discovering exo-planets at a rate only set by the available resources to follow up the detections;
- CoRoT has detected solar type oscillations in solar type stars at a level so far unprecedented apart for observations of our own Sun,;
- CoRoT is observing all kinds of activity on a large domain of frequencies from multi-mode oscillations, signature of erratic superficial motions, to the signature of differential rotation - as seen by the different periods of the passage of sunspots at different latitudes.
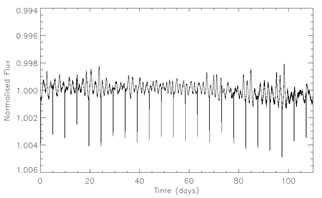
An example of light curve from CoRoT.
This is demonstrated by this example. The data here cover 120 days of uninterrupted observation. It is important to note that what is presented here is raw data (so-called N0 data), and that further refinements will follow shortly. On this "light curve" one can immediately see a variety of variabilities and time scales:
- A "periodic" variation over approximately 1.5 days;
- A long term variation, producting a sort of beat phenomenon with a period of roughly 40 days. Let’s remark that the continuity of the observations over 120 days was necessary to detect this effect. These large scale variations are probably due to the rotation of the star, which has a non uniform surface (as seen on a smaller scale on the Sun), but it is too early to give a firm interpretation;
- very narrow spikes occurring regularly superimposed on top of this long term variations. They are the signature of a smaller body orbiting the star with a period of almost 5 days. The nature of this object ( a very big planet or a very small star) will be confirmed by follow-up observations on the ground.
The scientific interpretation of these data will be very soon presented in several papers being prepared for peer reviewed journals.
To know more: