SN 2009ip Swift/XRT
observations
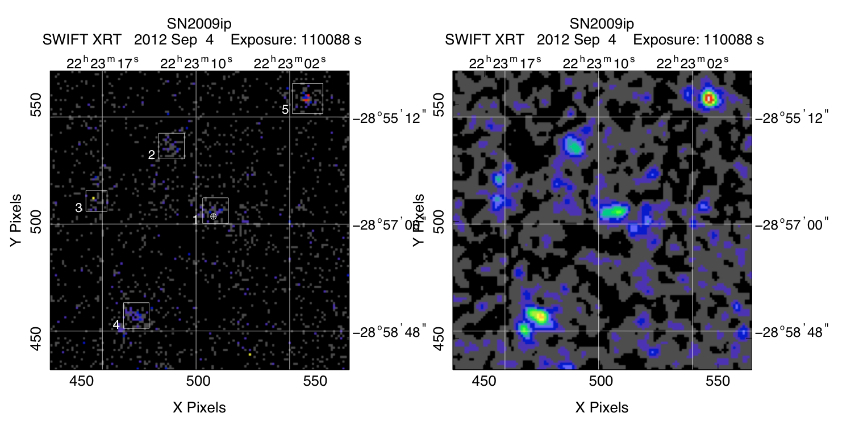
FIG.1
Left: Summed Swift/XRT images of SN 2009ip. The SN 2009ip
position is marked with a circled cross at the center of the image.
Detected sources are marked with a square and a number (using XIMAGE
detect). SN 2009ip coincides with source nr.1.
Right: Smoothed image to highlight SN 2009ip at the center.
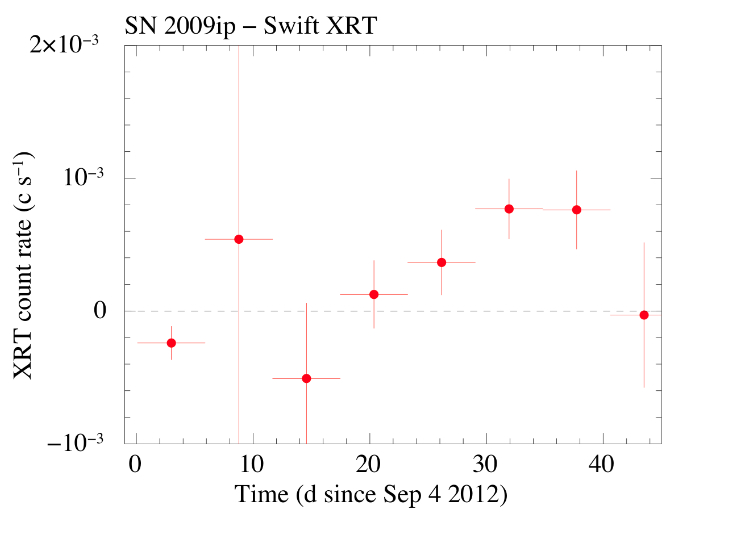
FIG. 2
Swift/XRT background subtracted light curve. The light curve is in
the 0.3-10 keV energy band and has been extracted from a circular
region of 10 arcsec radius centered on the SN 2009ip position. This
extracttion radius corresponds to the instrumental Half Energy Width
so that the corrected count rate should be doubled.
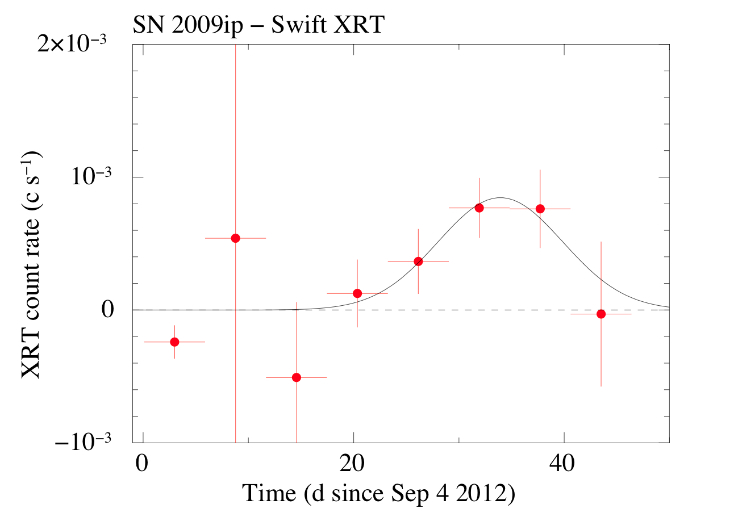
FIG. 3
Swift/XRT light curve as above, fitted with a Gaussian model.