
Fig. 2 EXO0748-676 Swift XRT spectra taken on 29 and 30 Oct. 2008. The fit has been performed with an absorbed black body spectrum with NH=1.1x10^21 cm-2 (fixed).
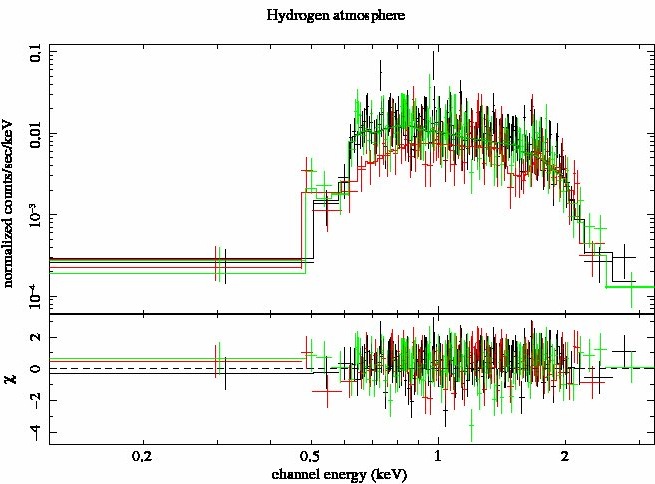
Fig. 3a EXO0748-676 Chandra LETG-ACIS-S simulated spectrum assuming the Swift XRT input spectrum and exposing for 50 ks. The spectrum has been simulated for an hydrogen NS atmosphere obtaining 710 counts at order0, 475 at order-1 and 665 at order1. Data have been rebinned to 5 counts per bin.
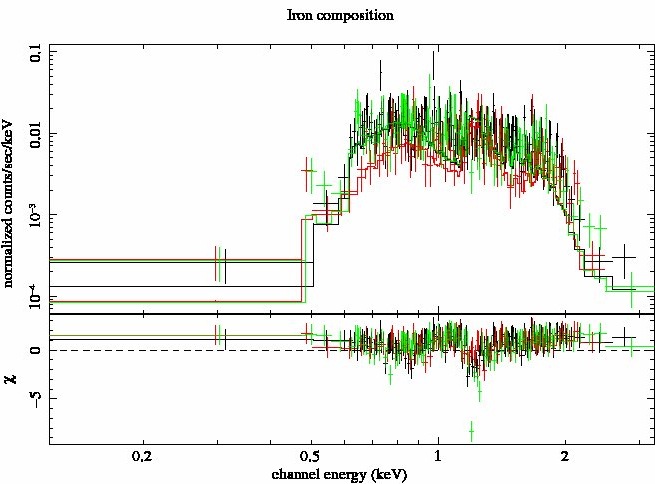
Fig. 3b Same as above but fitting the simulated data with a iron composition NS atmosphere.

Fig. 3c As above but adding to the NS hydrogen atmosphere model an emission at 0.9 keV at the instrument resolution and with an equivalent witdht of 20 A (thus mimicking the result of an absorption line at the same energy).